Rental yield · Australia
Rental yields across Australia
Every state and territory, its capital and its largest regional cities, on government data. 378 suburbs have a published yield, and every page says what its government releases.
- Suburb yieldsNew South Wales, Victoria and South Australia
- Current rentsQueensland
- 2021 Census onlyWestern Australia, Tasmania, the ACT and the Northern Territory
01 · States and territories
Coverage follows what governments publish.
Popurise publishes a suburb rental yield page only where government data gives a rent and a sale price for the same type of dwelling, today in New South Wales, Victoria and South Australia. Every state and territory publishes something about rents; far fewer publish sale prices for suburbs under a licence that allows reuse. Each page shows what is published there, current rents where they exist, and a calculator for your own numbers.
02 · Every suburb
Every suburb and locality in Australia, one page each.
14,520 pages: every ABS suburb and locality in the eight states and territories, except rural places where the 2021 Census counted no homes and the ABS's balancing codes. Each shows what its government data publishes, from a market yield to current rents to the 2021 Census, and never invents the rest.
- 14,520suburbs and localities
- 2,772with a market yield
- 2,148with current rents
- 9,600with the 2021 Census or less
Type two letters, or an NSW postcode.
03 · Highest and lowest
Where published yields are highest and lowest.
Each mark is one suburb’s own gross yield, among published suburbs with a reliable yield (at least 30 sales and 30 new bonds behind each median). A higher gross yield often comes with a lower price, and with risks a yield does not show. NSW figures are postcode benchmarks.
New South Wales229 suburbs
Lowest: Strathfield 1.24%Highest: Wellington 7.73%
Victoria60 suburbs
Lowest: Balwyn 1.44%Highest: Morwell 5.30%
South Australia25 suburbs
Lowest: Prospect 1.98%Highest: Munno Para West 4.23%
Houses · 314 published suburbs with a reliable yield
Apartments and units · 187 published suburbs with a reliable yield
Highest
04 · Your numbers
Work out the yield on a property you are looking at.
Enter the asking price and the expected weekly rent of any Australian property for its gross yield, then open the costs and the loan for the net yield and the weekly cash flow. To start from published medians, open a state, city or suburb page. Nothing is saved or sent.
Gross rental yield
—
Enter a purchase price to see the gross rental yield.
After costs and the loan
Yield is what the property earns. Cash flow is what you keep.
Gross yield ignores every cost. Add the running costs to see the net operating yield, then the loan to see what the property costs or returns each week. Every figure below is a starting assumption to replace with your own.
Running the property
$8,600 a year
The loan
No loan — a cash purchase
Cash flow after the loan · before tax
—
Enter a purchase price to see the weekly cash flow.
- Cash flow per year
- —
- Monthly repayment
- None
- Break-even rent
- $188 / week
- Rent after vacancy
- $0 / year
- Running costs
- $8,600 / year
- Loan repayments
- $0 / year
Enter a purchase price to see what the property earns and what it costs to hold.
General information only. This is arithmetic on the numbers entered, before income tax, buying costs and any change in value. It is not financial advice or a recommendation.
Stress test
What if rates rise, the rent falls or the property sits empty?
Each line changes one thing and leaves the rest as entered. Choose a line to apply it to the figures above, then return to the base case.
Weekly cash flow after the loan, before tax. The vacancy line adds 4 weeks to the vacancy already entered. These are single-move tests, not forecasts: they show how sensitive the result is, not what will happen.
05 · Cities and regions
Eight capitals, and the ten largest regional cities.
Capital cities follow the ABS Greater Capital City areas; Canberra is the ACT page. Regional centres are the ABS Significant Urban Areas outside the capitals with at least 100,000 residents at the 2021 Census.
06 · State-wide benchmarks
New South Wales is the only state that publishes matching state-wide medians.
DCJ publishes NSW-wide and regional medians in the same tables as its postcode figures, so the same calculation works for the whole state and its regions. No other state publishes matching area-wide sale and rent medians, so no state-wide yield is shown for them.
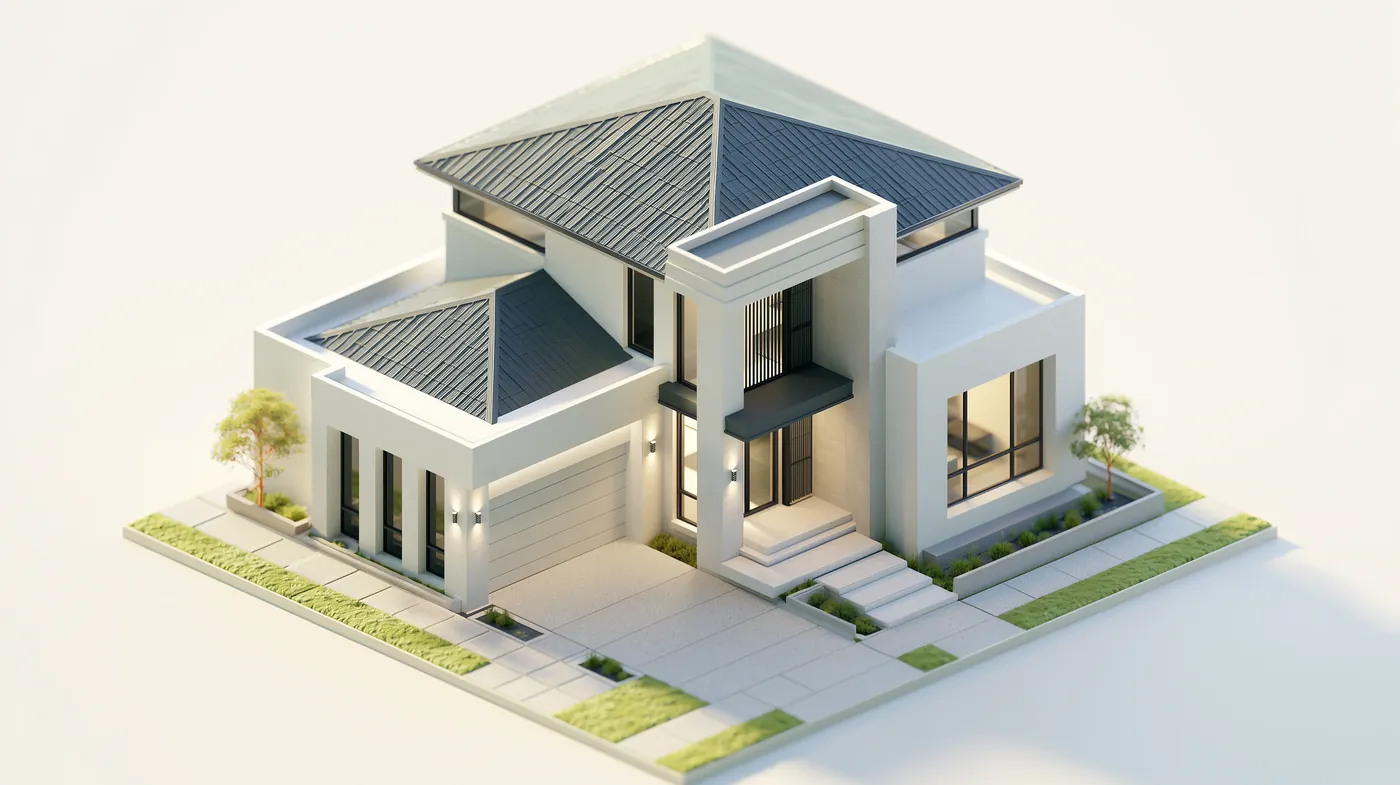
Houses
3.25%
$700 / week median rent on a $1,120,000 median sale price.
House rent, new bonds, January to March 2026. Non-strata sales (mostly houses), October to December 2025.
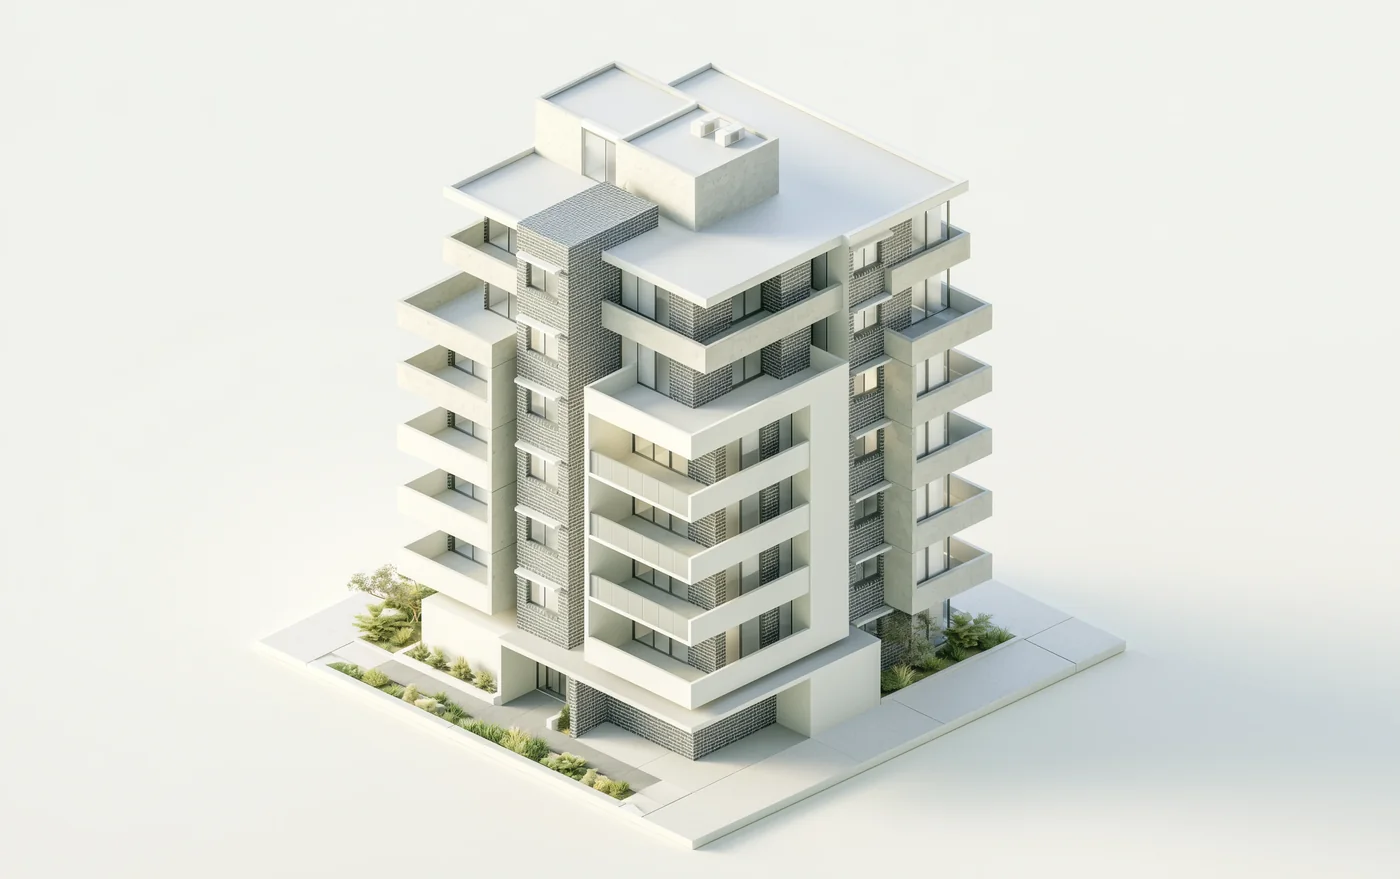
Apartments and units
4.76%
$750 / week median rent on a $820,000 median sale price.
Flat or unit rent, new bonds, January to March 2026. Strata sales (mostly apartments and units), October to December 2025.
Gross rental yield: median weekly rent × 52 ÷ median sale price, from New South Wales’s own published medians (NSW Department of Communities and Justice). Illustrative models, not specific properties.
The same calculation, region by region.
Houses and apartments for each area DCJ publishes, on one scale. Where the two sit far apart, the dwelling type matters more than the address.
New South WalesHouses $700 / week on $1,120,000Units $750 / week on $820,000
New South Wales: houses 3.25%, apartments and units 4.76%.
Greater SydneyHouses $800 / week on $1,580,000Units $780 / week on $855,000
Greater Sydney: houses 2.63%, apartments and units 4.74%.
Newcastle and Lake MacquarieHouses $680 / week on $941,000Units $550 / week on $745,000
Newcastle and Lake Macquarie: houses 3.76%, apartments and units 3.84%.
WollongongHouses $750 / week on $1,165,000Units $580 / week on $830,000
Wollongong: houses 3.35%, apartments and units 3.63%.
Rest of NSW (outside the Greater Metropolitan Region)Houses $560 / week on $720,000Units $420 / week on $635,000
Rest of NSW (outside the Greater Metropolitan Region): houses 4.04%, apartments and units 3.44%.
07 · How Australia rents
Renting looks different in every state.
How homes were built and held on Census night in August 2021, from the ABS, for Australia and the areas around it. It describes the shape of the market, not today’s rents or prices: the Census counts every rented home, old and new tenancies, so its median rent sits below a new tenancy’s.
Dwelling structure, share of occupied homes, 2021 Census
- Australia72% houses · 14% flats
- New South Wales66% houses · 22% flats
- Victoria73% houses · 12% flats
- Queensland75% houses · 12% flats
- Western Australia80% houses · 6% flats
- South Australia78% houses · 7% flats
- Tasmania88% houses · 5% flats
- Australian Capital Territory63% houses · 19% flats
- Northern Territory67% houses · 18% flats
- 72.3%Separate houses
- 12.6%Semi-detached, terraces and townhouses
- 14.2%Flats and apartments
- 0.8%Other or not stated
The four figures are Australia’s; the bars put it beside New South Wales, Victoria, Queensland, Western Australia, South Australia, Tasmania, the Australian Capital Territory and the Northern Territory.
| Area | Rented | Median rent | Median mortgage | Household income |
|---|---|---|---|---|
| Australia25,422,788 residents | 30.6% | $375 / week | $1,863 / month | $1,746 / week |
| New South Wales8,072,163 residents | 32.6% | $420 / week | $2,167 / month | $1,829 / week |
| Victoria6,503,491 residents | 28.5% | $370 / week | $1,859 / month | $1,759 / week |
| Queensland5,156,138 residents | 33.1% | $365 / week | $1,733 / month | $1,675 / week |
| Western Australia2,660,026 residents | 27.3% | $340 / week | $1,842 / month | $1,815 / week |
| South Australia1,781,516 residents | 27.6% | $300 / week | $1,500 / month | $1,455 / week |
| Tasmania557,571 residents | 26.4% | $290 / week | $1,313 / month | $1,358 / week |
| Australian Capital Territory454,499 residents | 30.7% | $450 / week | $2,080 / month | $2,373 / week |
| Northern Territory232,605 residents | 47.6% | $325 / week | $2,000 / month | $2,061 / week |
08 · Method and sources
Where the numbers come from, and when.
A suburb page is published only where government data gives a rent and a sale price for the same type of dwelling, each with at least 30 observations, from open-licensed sources. Gross yield is the median weekly rent × 52 ÷ the median sale price. Area figures are each area's own published medians. Nothing is estimated from listings or a property portal, and no figure is averaged across suburbs.
How each state’s figures are classified
New South Wales
NSW publishes rents for houses, flats and units, and townhouses, and sale prices for non-strata (mostly houses) and strata (mostly apartments and units, with some townhouses) dwellings. House rent is paired with non-strata sales and flat or unit rent with strata sales. Where townhouses are a third or more of a postcode's strata-type rental homes, the strata median is too mixed to compare with a flat rent, so apartments and units there show rent only. No townhouse sale median is published, so townhouses show rent only.
Victoria
Victoria publishes sale medians for houses and for units by suburb, and rents for flats by 1 to 3 bedrooms and houses by 2 to 4 bedrooms, for rental areas. A house yield divides the 3-bedroom house rent by the median house price, and an apartment or unit yield the 2-bedroom flat rent by the median unit price. Neither source separates apartments from other attached units, so in suburbs with few apartments the unit figures mostly describe other units.
South Australia
South Australia publishes rents for houses and for flats and units by suburb, and a median sale price for houses only, across metropolitan Adelaide. Apartments and units therefore show rent only.
10 sources, all government, all open licence
Australian Statistical Geography Standard Edition 3 — suburbs and localities, postal areas, capital cities, urban areasAustralian Bureau of Statistics · Edition 3 (July 2021 to June 2026)
Not applicable.
- Area
- SAL representative points, POA polygons (NSW), GCCSA polygons (Sydney, Melbourne, Adelaide), SUA polygons (Newcastle – Maitland, Wollongong, Geelong, Ballarat, Bendigo); SAL lists for the states not covered
- Licence
- Creative Commons Attribution 4.0 International
- Retrieved
- 15 November 2026
Census of Population and Housing 2021 — G36 Dwelling structure, by suburb and localityAustralian Bureau of Statistics · Census night, 10 August 2021
Separate house; semi-detached, row or terrace house, townhouse; flat or apartment; other dwelling.
- Area
- ABS Suburbs and Localities (SAL), ASGS Edition 3
- Licence
- Creative Commons Attribution 4.0 International
- Retrieved
- 15 November 2026
Census of Population and Housing 2021 — G01, G02, G36 and G37 for Australia, states, capital cities and urban areasAustralian Bureau of Statistics · Census night, 10 August 2021
Population (G01); median weekly rent, monthly mortgage repayment and weekly household income (G02); dwelling structure (G36); tenure (G37).
- Area
- Australia; states and territories; Greater Capital City Statistical Areas; Significant Urban Areas (ASGS Edition 3)
- Licence
- Creative Commons Attribution 4.0 International
- Retrieved
- 16 November 2026
Rent and Sales Report — rent tables, January to March 2026 quarterNSW Department of Communities and Justice · January to March 2026
House, Flat/Unit, Townhouse, Other; by bedrooms.
- Area
- NSW postcode; council area; Greater Sydney and its rings; NSW
- Licence
- Creative Commons Attribution 4.0 International
- Retrieved
- 2 August 2026
Rent and Sales Report — sales tables, October to December 2025 quarterNSW Department of Communities and Justice · October to December 2025
Total, Non-strata (mostly houses), Strata (mostly apartments and units, some townhouses).
- Area
- NSW postcode; council area; Greater Sydney and its rings; NSW
- Licence
- Creative Commons Attribution 4.0 International
- Retrieved
- 2 August 2026
Metropolitan median house sales — April to June 2026 quarterDepartment for Housing and Urban Development (South Australia) · April to June 2026
Houses only.
- Area
- Metropolitan Adelaide suburb, with council
- Licence
- Creative Commons Attribution 4.0 International
- Retrieved
- 15 November 2026
Private Rent Report — April to June 2026 quarterSouth Australian Housing Trust, from Consumer and Business Services bond data · April to June 2026
Flats/units and houses, by 1, 2, 3 and 4 or more bedrooms; other/unknown.
- Area
- SA suburb; postcode; SA Government region; council area
- Licence
- Creative Commons Attribution 4.0 International
- Retrieved
- 15 November 2026
Rental Report — moving annual rents by suburb and town, September quarter 2025Homes Victoria, from Residential Tenancies Bond Authority data · Year to September 2025 (moving annual)
Flats by 1, 2 and 3 bedrooms; houses by 2, 3 and 4 bedrooms.
- Area
- RTBA rental areas: single suburbs and multi-suburb groupings
- Licence
- Creative Commons Attribution 4.0 International
- Retrieved
- 5 August 2026
Victorian Property Sales Report — median house by suburb, October to December 2025 quarterValuer-General Victoria, Department of Transport and Planning · October to December 2025
Houses.
- Area
- Victorian suburb or locality
- Licence
- Creative Commons Attribution 4.0 International
- Retrieved
- 15 November 2026
Victorian Property Sales Report — median unit by suburb, October to December 2025 quarterValuer-General Victoria, Department of Transport and Planning · October to December 2025
Units (apartments, units and flats), as classified by the Valuer-General.
- Area
- Victorian suburb or locality
- Licence
- Creative Commons Attribution 4.0 International
- Retrieved
- 5 August 2026
Australian Bureau of Statistics, ASGS Edition 3, licensed under Creative Commons Attribution 4.0 International ↗, accessed 15 November 2026. Australian Bureau of Statistics, Census of Population and Housing 2021, licensed under Creative Commons Attribution 4.0 International ↗, accessed 16 November 2026. © State of New South Wales (Department of Communities and Justice), licensed under Creative Commons Attribution 4.0 International ↗, accessed 2 August 2026. Department for Housing and Urban Development, Metropolitan Median House Sales (data.sa.gov.au), licensed under Creative Commons Attribution 4.0 International ↗, accessed 15 November 2026. South Australian Housing Trust, Private Rent Report (data.sa.gov.au), licensed under Creative Commons Attribution 4.0 International ↗, accessed 15 November 2026. Homes Victoria, Rental Report (Residential Tenancies Bond Authority data), licensed under Creative Commons Attribution 4.0 International ↗, accessed 5 August 2026. Valuer-General Victoria, Victorian Property Sales Report, licensed under Creative Commons Attribution 4.0 International ↗, accessed 5 August 2026. Popurise has calculated the yields and other figures from these sources; the publishers have not reviewed or endorsed them.
Important information
Popurise provides general information and calculation tools. These pages are built from published government medians, public sources and the assumptions shown. They are not financial, credit, tax or legal advice, a property valuation, a forecast or a recommendation to buy, sell or choose a particular loan. They do not consider your goals, financial situation or needs. Check the property information and loan terms, and consider independent professional advice before acting.
Common questions
Rental yields in Australia, answered plainly.
What is the rental yield in Australia?
There is no single Australian figure that compares like with like, so Popurise does not publish one. Across the 378 suburbs with a published page, gross yields run from 1.24% to 7.73% for houses and 1.09% to 7.08% for apartments and units. Each state, city and suburb page shows its own figures, sources and dates.
Which states does Popurise cover?
Suburb yields are published for New South Wales, Victoria and South Australia, where the state government publishes rents and sale prices for suburbs or postcodes under an open licence. Queensland publishes current rents but no matching sale prices, so its pages show rents and a calculator. Western Australia, Tasmania, Australian Capital Territory and Northern Territory publish neither current median rents nor sale prices openly, so their pages explain what is available, carry the calculator, and are kept out of search results.
How is gross rental yield calculated?
Multiply the median weekly rent by 52 to get a year's rent, divide it by the median sale price, and multiply by 100. For example, $600 a week is $31,200 a year; on a price of $800,000 that is a gross yield of 3.90%. Net yield takes off vacancy and running costs first; cash flow also takes off the loan repayments.
Why does Popurise compare dwelling types instead of quoting one suburb yield?
Houses and apartments in the same suburb have very different prices and rents, so one blended figure would describe neither. Each page shows a yield only for a dwelling type where the rent and the sale price describe that same type.
How current are the figures?
Each page shows the period of every rent and sale median it uses, and figures stop publishing when they are more than 24 months old. The current pages were generated from the pinned releases on November 2026; the newest rents are Queensland's, for July to September 2026.
Found a property worth a closer look? Analyse the actual listing free.
A median is only a starting point. Paste a listing into Popurise Investor to see the buying costs, a rent check, the expenses, the loan and the weekly cash flow for that property, and the price at which the numbers work. The first analysis is free.